Page 41

Infographic: Carbon Dioxide in the Classroom

14

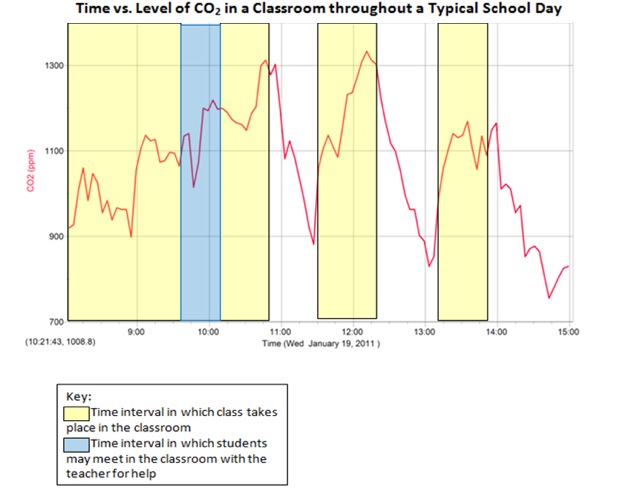
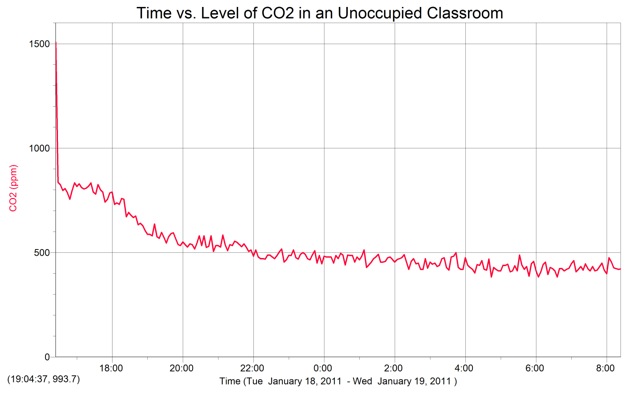
Researchers believe that high levels of CO2 in the classroom as a result of poor ventilation in schools can cause students to become drowsy. The data illustrated in these two graphs was gathered from a classroom with a volume of 10, 764 ft3 using a Logger Pro carbon dioxide sensor. The CO2 sensor was plugged into a laptop and left in the classroom for a given period of time to consistently record the amount of carbon dioxide in parts per millions.


The first graph depicts the data collected during an experiment in which the level of CO2 in the classroom was collected consistently from when the school day ended until the following morning. The second graph illustrates the data collected during an experiment in which the level of CO2 in a classroom was measured consistently throughout an entire school day. While the second graph shows that the level of CO2 in a classroom decreases when no one inhabits the classroom, the first graph demonstrates that the level of CO2 in a classroom increases when students are in the classroom. The decrease of CO2 in the classroom when classes are not in session, as shown in both graphs, implying that CO2 levels can decrease in a short amount of time when the room is uninhabited. 

Thus, the data show that the level of CO2 in the room increases when classes take place; however, CO2 levels can be managed by limiting the number of classes that occur in a classroom and ensuring that these classes do not occur consecutively. By limiting the level of CO2 in the classroom, schools may be able to decrease student drowsiness during the day.

Creative Commons License
This work is licensed under a Creative Commons Attribution-NonCommercial-NoDerivs 3.0 Unported License

Infographic: What Do People Know about CFLs?

1

The information in these graphs show that most of the respondents, which include high school teachers, high school students, and other adults, were not aware that Compact Fluorescent Light bulbs (CFLs) contain mercury. (To learn more about CFLs and their problems click HERE.) Most answered that they would throw the bulbs in the trash. After the respondents were informed of the mercury in CFLs, 42% did not know how to recycle them. However, 80.0% said CFLs would have a negative impact on the environment if not recycled.  These replies are significant because the variation of the respondents show what most people know about CFLs


These pie charts tell us that maybe manufacturers have not done a good enough job to alert their buyers that these bulbs contain mercury and, therefore, need to be recycled. These results should encourage manufacturers to better alert the public, or produce bulbs that do not contain mercury.


Creative Commons License
This work is licensed under a Creative Commons Attribution-NonCommercial-NoDerivs 3.0 Unported License

Infographic: Effects of Tanning Survey

3


These are the results of a survey of a 100 girls at an area all girls high school. These students voluntarily answered the survey questions about tanning and the effects of tanning.

Image is everything in a teenage girl’s life and so tanning helps a teenager keep that image of perfection. These results show that the students at the school surveyed are smart about their tanning.  Less than half of the 100 students surveyed go tanning. Although there are the people that ignore the effects of tanning, the majority take the effects into account and adjust their tanning habits. These results are very comforting to learn because the girls who are smart in their tanning habits will be better off in the future According to the Skin Cancer Foundation, these girls’ skin will be healthier in the future and less likely to get a form of skin cancer.


Related stories: Serious Risk with Indoor Tanning, Sunscreen-Cancer Preventer or Promoter?, A Simple Solution to a Sunny Situation 

Erica Shurmur 

Creative Commons License
This work is licensed under a Creative Commons Attribution-NonCommercial-NoDerivs 3.0 Unported License

Infographic: Days Absent/Year vs. Cups of Caffeine/Day

4


A survey of 146 high school students, ages 14-18, asked how much caffeine (coffee, soda, tea, and energy drinks) that student drinks daily and how many days they were absent during the school per year. The above graph shows the relationship between the average numbers of days absent a student is per year and how much caffeine a student drinks daily. The survey was self-reporting, meaning the students answered these questions at their own discretion. The results showed that, typically, the student who drinks more caffeine is absent from school more days than a student who does not drink caffeine. The exception is the students that drink four or more cups of caffeine per day. Only six students drink four or more cups of caffeine per day, and this created a lack of data for that group that may affect the conclusions. In general, the more caffeine a student drinks, the more days absent that student is from school. 

Creative Commons License
This work is licensed under a Creative Commons Attribution-NonCommercial-NoDerivs 3.0 Unported License

Minority Science Showcase

0

SciJourner reports from the Minority Science Showcase at the St.Louis Science Center.

Creative Commons License
This work is licensed under a Creative Commons Attribution-NonCommercial-NoDerivs 3.0 Unported License

Controversy over High Fructose Corn Syrup

0

Many people avoid “High Fructose Corn Syrup” (HFCS) because they believe it is unhealthy and worse than regular sugar. Fears of HFCS are usually about obesity, cholesterol, diabetes, or even liver damage.

 The U. S. Department of Agriculture’s Economic Research Service found that in 1970 the average person consumed about 0.5 pounds of HFCS, while in the same year a person ate 16.8 pounds of other sweeteners.  By 1999, consumption of HFCS reached its peak, with 63.7 pounds of HFCS per person and 22 pounds of other sweeteners per year. Then, as people became more health conscious, the amounts of sugar consumption decreased. In 2009, an average person consumed 50.1 pounds of HFCS and 17 pounds of other sweeteners per year.

 HFCS is manufactured from corn syrup, which is primarily glucose, according to the Corn Refiners Association. An added enzyme converts some of the glucose into fructose, the same sugar found in fruits. Afterward, they are mixed together.  

  SweetSuprise.com which is another website of the Corn Refiners Association, says that HFCS is a made up of 42–55% fructose and the rest is glucose. Regular table sugar is equal parts glucose and fructose. They have almost the same chemical makeup, so the body can’t tell the difference between HFCS and table sugar, says SweetSuprise.com.

  Devra Shiba an Illinois-based Clinical Dietitian/Nutritionist for 34 years, says that both cane sugar and HFCS are chemically similar. Yet, Shiba states, “Excess amounts of either sugar need to be limited in the diet because of the health risks associated with overconsumption.” Both sugars can also lead to “dental cavities, poor nutrition, digestive problems, and high triglyceride levels.”

  Sharon S Elliott, Nancy L Keim, Judith S Stern, Karen Teff and Peter J Havel from the Department of Nutrition, University of California at Davis did a study in 2002 on fructose and weight gain. They said that “individuals who consume diets that are high in dietary fructose could therefore increase the likelihood of weight gain and metabolism issues.”

 Mehmet Oz, who is often seen on Oprah and is a professor of surgery at Columbia University in New York, tells viewers that HFCS is bad. "It blocks the ability of a chemical called leptin, which is the way your fat tells your brain it's there,”  Leptin is a protein hormone that regulates the amount of energy the body takes in.

 “They are both natural,” says Neva Cochran, a registered dietitian on MommyCast, a videocast website for parents to get answers to their health questions concerning their children. “One [table sugar] comes from cane and one comes from corn.” Sugar cane and cornstarch are both natural ingredients, making respectively table sugar and high fructose corn syrup. Cochran also says that both sweeteners have the same calories, but HFCS reduces the tartness from acid ingredients, whereas table sugar just adds a sweeter taste. She believes that there are many benefits that HFCS can give to a product such as flavor to substitutes in food. Thus, HFCS is in more foods on the market.

  Richard Forshee, of the University of Maryland Center for Food, Nutrition, and Agriculture Policy, says that there are many other reasons for the rising obesity rates in the US and it is impossible to prove that an ingredient like HFCS is to blame. Things to factor in are lack of physical activity, availability of types of food, and fast food, and there are many other reasons that could explain individual increase in obesity.

 A 2007 study done by Kathleen J Melanson, a researcher from the Department of Nutrition and Foods at the University of Rhode Island, found there were no differences in metabolic effects between cane sugar and HFCS. She studied lean women and recorded the effects of corn syrup and sugars.

  Marilyn D. Schorin, a nutritional consultant to various food companes, stated in 2006, “Given what we know about the metabolism of orally ingested sugars, it is difficult to identify a plausible physiological explanation for how approximately equal amounts of fructose and glucose should have differential effects when chemically bonded (such as in sucrose) or not (such as in HFCS).” Anna Timmerberg

Relate story: Corn for Fuel of Corn for Food? 


Creative Commons License
This work is licensed under a Creative Commons Attribution-NonCommercial-NoDerivs 3.0 Unported License

An Interview with Dr. Ralph Cicerone

0

A SciJourner exclusive: A conversation with the President of the National Academy of Sciences. 


Creative Commons License
This work is licensed under a Creative Commons Attribution-NonCommercial-NoDerivs 3.0 Unported License

Is Bottled Water Safer Than Tap Water?

12

 Have you ever picked up a bottle of water from a convenience store when you were feeling thirsty? If you have answered yes, then you are one of the Americans who combined drink approximately 8.5 billion gallons of bottled water every year, according to the International Bottled Water Association. But  that bottled water may not be so different than what is coming out of your tap.  

 Bottled water can come from ponds, springs, lakes, and reservoirs, and can be up to 10,000 times more expensive, according to a 2006 National Geographic news article. Most of the individuals who buy bottled water claim it tastes better and the others buy it for the health benefits.

 In a study conducted in 1999 by the Natural Resources Defense Council, an environmental group, about one-third of the 103 brands that were tested were shown to be slightly contaminated with some of the same materials found in normal tap water, such as synthetic organic chemicals and bacteria. The other samples, however, showed no signs of contaminants and some were even high quality, says the group.

 So is bottled water safer than tap water? Dr. Daniel Giammer of Washington University in St. Louis in a 2004 press release says no. Giammer is a faculty member in the Environmental Engineering Science Program and states, “The tap water we drink meets very strict standards that are designed to protect our health. These are developed over many years of study and they all include fairly large factors of safety. Any differences between tap and bottled water, in terms of health, are negligible.” While tap water can contain some harmful contaminants, there is not enough of any specific toxin to have an impact on the human body.

 Tap water for St. Louis County and St. Charles County comes from the Missouri and Meramec Rivers. According to the 2010 St. Louis County water quality report, there are traces of lead, copper, and arsenic in tap water, but these amounts are so small that they can barely be detected. For example, the amount of lead in St. Louis County tap water is 7.5 times under the Maximum Contaminant Level (MCL)-the highest level of a contaminant allowed in drinking water under state and federal regulations. Copper is about 70 times below the MCL and arsenic is about 10 times under, according to the 2010 water quality report, which is an overview of the tap water tests and contaminants found throughout the year.

 But bottled water does not have specific contaminant levels. According to a 2009 Consumer Reports article, state standards for bottled water are less strict than state standards for public tap water. This means that there could be more contaminants and toxins in your bottled water than there are in your tap water. In fact, in some cases, your bottled water may actually be tap water according to a CNN report.  

 Some producers of bottled water are making it easier to distinguish if the bottled water being purchased comes from a municipal source, which is another term for tap water. “PepsiCo Inc. will spell out that its Aquafina bottled water is made with tap water, a concession to the growing environmental and political opposition to the bottled water industry,” states a 2007 CNN broadcast. The labels were changed in 2007 to read “PWS” which means “public water source” according to a 2007 Fox News broadcast, or just “municipal source.”  

So why is bottled water such a big market? Well not all bottled water is tap water in disguise. The bottled waters that are purified have met regulations set by the EPA, and is subject to annual inspections by the International Bottled Water Association and possibly NSF International.

 Although purified water is “not necessarily free from microbes” according to the EPA, different methods such as distillation or reverse osmosis could eliminate these microbes. Reverse osmosis is a purifying process where water is forced from a highly concentrated solution to a more dilute solution through a membrane that acts as a filter. The larger contaminants cannot pass through the membrane and the result is purified water. This is a widely used and efficient way to thoroughly purify contaminated water. This information regarding how your bottled water was purified can be found on the label either under the nutrition information or next to the brand name. So it is always best to check the label of your bottled water.

 For example, Nestle Waters, a large bottled water company that produces many different brands of bottled water, admits to using municipal sources, but they also assure their consumers that their water has been purified to meet the highest standards by using reverse osmosis. Nestle also adds nutrients and minerals back into their water not only for the benefits but also for taste. This is common with many other bottled water brands as well.

 The other big contributor to the bottled market industry is convenience. It is easy to grab a bottle out of the fridge rather than take a glass of tap water outside on a hot day. It is also easy to buy one at your local convenience store whenever you are feeling thirsty. 

Creative Commons License
This work is licensed under a Creative Commons Attribution-NonCommercial-NoDerivs 3.0 Unported License

Immigration and Living With Type Two Diabetes

3

by Fowzia Osman, Rockwood Summit High School (Fenton, MO)

Somalia, located in eastern Africa in a region called “the horn of Africa,” is a

Pictured above is halwa, a traditional Somali delicacy. Surrounding the plate is a loaf of bread, which is eaten with this sweet treat to “balance” the pallet, a bowl of mango, our family’s favorite fruit, and a glass of flavored coconut juice. Also pictured is Zamzam water, imported from Saudi Arabia and a card for the religious holiday, Eid Al Fitr. Credit: Fowzia Osman

 country that has experienced 40 years of civil unrest. Since 1992, Somalia has had a significant amount of migration to North America. US Department of Homeland Security reports that there are now an estimated 70,000 to 200,000 Somali-Americans. With this migration, the immigrants have developed diabetes. My family is of Somali and Yemeni decent. Therefore, I have experienced firsthand the effects of immigration.

 My mom’s family, who are primarily Yeminis, lived in the capital of Somalia, Mogadishu. Since Mogadishu is a coastal city, their diet was essentially sea based. My mom stated that, “there were no refrigerators, so we caught our food the same day and ate it fresh.” Having no refrigerators eliminated the availability of processed foods.

  My aunt, who is related to me on my mom’s side, developed diabetes and high blood pressure. “When I went to Europe there was just so many different types of chocolate, I wanted to try them all,” she states. My aunt is an extremely healthy person and makes wise choices. She has even influenced my family to make healthier choices ever since she developed type two diabetes three years ago. 

 Diabetes is a condition in which the amount of glucose in the blood is high, because the body does not produce enough insulin. Insulin is necessary for the body to break down glucose in order to use it for energy. This condition is developed from either heredity or formed from unhealthy food consumption. The type of diabetes my aunt has is type two, and developed because immigrants are used to healthier foods. Therefore, the refugees in the western world are more prone to diabetes and other risks.

  But my aunt is not alone, because a 2010 study published in the Canadian Medical Association Journal, which examined around 1.1 million Canadian immigrants, found that those from Africa had twice the risk of developing diabetes compared to long-term residents or immigrants from Europe or North America. This is the result of the extensive lifestyle changes and contributed to the risk of long-term diabetes.

 The article in the Canadian Medical Association Journal also suggests that, among several risk factors, the lower standard of living for immigrants has a direct relationship with increasing the risk of diabetes.. If a person is used to eating fresh, healthy, and non-processed foods, as well as walking everywhere, and moves to an environment where processed food is extremely common, the body receives extra sugars that it is not used to.

My aunt says, “it is bothersome that I cannot eat any Swedish chocolate my brother sends me from Europe or eat a Hersey bar or even eat halwa [a Somali food that is gelatinous and pure sugar]. But I have to deal with it, and I am glad that I have helped my cousin and her children to become more health conscious.”

Related stories: Living with a Diabetic Dad, Cause and Effects of Diabetes

For now, my aunt–the healthiest person I know–lives with type two diabetes, a disease that is normally a consequence of obesity, inactivity, poor diet and aging. Fowzia Osman

Creative Commons License
This work is licensed under a Creative Commons Attribution-NonCommercial-NoDerivs 3.0 Unported License

Expanding Population Eating Away at Farmland

4

In March of 2011, the World Health Organization reported that two-thirds of the United States population is overweight. America likes its food. Additionally, the population of America is continuing to double every 50 years. On the other hand, according to the US Census and the Department of Agriculture (USDA), farmland is decreasing by about four million acres a year. As we cram more and more people onto 2.3 billion acres of American soil, we are feeding them on less than a fourth of that land; a number which has been consistently decreasing over the years. In the past eight years, Missouri alone has experienced a decrease of about a million acres of farmland. With a growing, ever-hungry population and a decrease in farmland, how will we continue to consume so much?


According to the estimated 2010 US Census, there are approximately 300 million people living in the United States, 6 million in Missouri. This is almost a 7% increase in the population size over 30 years. We are currently feeding our country, the third largest in the world, on 920 million acres of land, which is about 40% of the nation. Although this may seem like a lot, it is almost 140 million acres less than 35 years ago, according to the US Census data.


At the same time, we are eating more. The Missouri Department of Agriculture reported that over the past 30 years, our fish and shellfish consumption increased 3.9 lbs per capita, dairy intake by 64 lbs, flour and cereal products by 52 lbs and sugar intake by 16.2 lbs. And those are just a few of the major food commodities that have increased in consumption. 


In 2010, the Missouri Farmers Alliance published that on one acre of land an average Missouri corn farmer can grow roughly 183 bushels of corn. A dry bushel of corn weighs roughly 56 lbs. Yet, it takes about 35.7 bushels of corn to feed a family of 6 for a year, which equates to about 11 acres of corn; that’s almost 2 acres per person per year. Multiply that by 6 million, and that’s 10,928,400 acres—an area about the size of New Jersey and New Hampshire put together—just to feed the inhabitants of Missouri.


Although we don’t eat corn every day for a year, it, like other staple crops, is used to feed livestock, provide alternative energy, and as a dry ingredient in other foods. Monsanto, a Missouri-based agricultural company, predicts that if we don’t improve crop yields, we may need 300 million more acres nationwide to sustain the demand of the growing population by 2030. As farm land depletes and the population grows, it’s harder and harder to find space to grow all the crops that Missourian’s, and the entire global population, need.


The USDA claims that in the past 30 years Missouri cultivated land decreased from 28% to 26%, and depleted land became homes as urban areas spread throughout the state. The Missouri Department of Agriculture and Monsanto both have reported that we are now using only a quarter of the total land in Missouri to provide for its inhabitants, the rest is used to house Missouri’s 6 million populace, their work spaces, recreational parks, and government buildings. As farmland depletes and the population grows, it’s harder and harder to find space to grow all the crops that Missourians need.


In response to this shortage, the US has had to increase its imports of produce from other countries around the world, mainly Mexico, Costa Rica, Peru, and Chile. The USDA, and U.S. Department of Commerce show that in just one year, from 2009 to 2010, imports of fresh and frozen fruits increased by $834 million and fresh and frozen vegetables by $1,032 million.


Some researchers from Monsanto claim to have found some ways to compensate for lost land. Through advanced breeding and biotechnology, Monsanto has been able to successfully breed seeds that use less water and nutrients to grow, meaning they can grow more on less land.


“Corn is probably the best example of yield-related innovation for Monsanto products,” writes Jacqueline Weiss, a Scientific Applications Specialist from Monsanto, in an email. “The company is trying to do more with less—so there is still an emphasis on yield, but also on multiple disease resistant plants that are also drought tolerant and require less nitrogen input. Think of the product pipeline in two parts: one which develops superior yielding corn and one which develops sources of disease and pest resistance, etc. which come together to produce products for market.”


A Missouri Corn Farmer from Kansas City who serves as a representative of the Missouri Corn Growers Association and uses these innovations, Rob Korff, states that “with technology and engineering, we have more capacity today to harvest a crop in a more timely fashion, and do it in a more efficient use per acre.”


 “My personal opinion is that we will be able to meet the challenge of feeding the growing population. It’s always easier to solve a problem you’ve identified early,” writes Weiss. “I like [Harvard University biologist] E.O. Wilson’s view on this topic in The Future of Life, which is a few years old but still relevant. He basically states that humans have always found a way to produce enough food for a population to survive. There are famines, obviously, but they are almost always the result of poor distribution, not lack of enough food overall. While I do support the local/organic food movement, I think that the problem cannot be solved this way, especially not on a global scale. Innovation is needed, which is one of the reasons why I work for this company. Conventional breeding alone has led to a remarkable increase in yield up to the ‘molecular era’, but the addition of transgenic traits will take us to the next level by 2030.”


Creative Commons License
This work is licensed under a Creative Commons Attribution-NonCommercial-NoDerivs 3.0 Unported License